This is some fun I had, trying to replicate what was written in this post. I had been trying to understand what was happening here, and found this post on Hacker News very helpful.
It is a known fact that our eyes have more cones for green and red as compared to blue. The Bayer filter used for digital camera lenses is based upon this principle. This post tries to illustrate that using the following two arguments.
- Looking at only the blue channel of an image looks very dark.
- Tripling the pixel size of blue channel doesn’t cause much distortion in the final image.
Hence, our eyes suck at blue.
Their argument is flawed, but we could try and improve a few things.
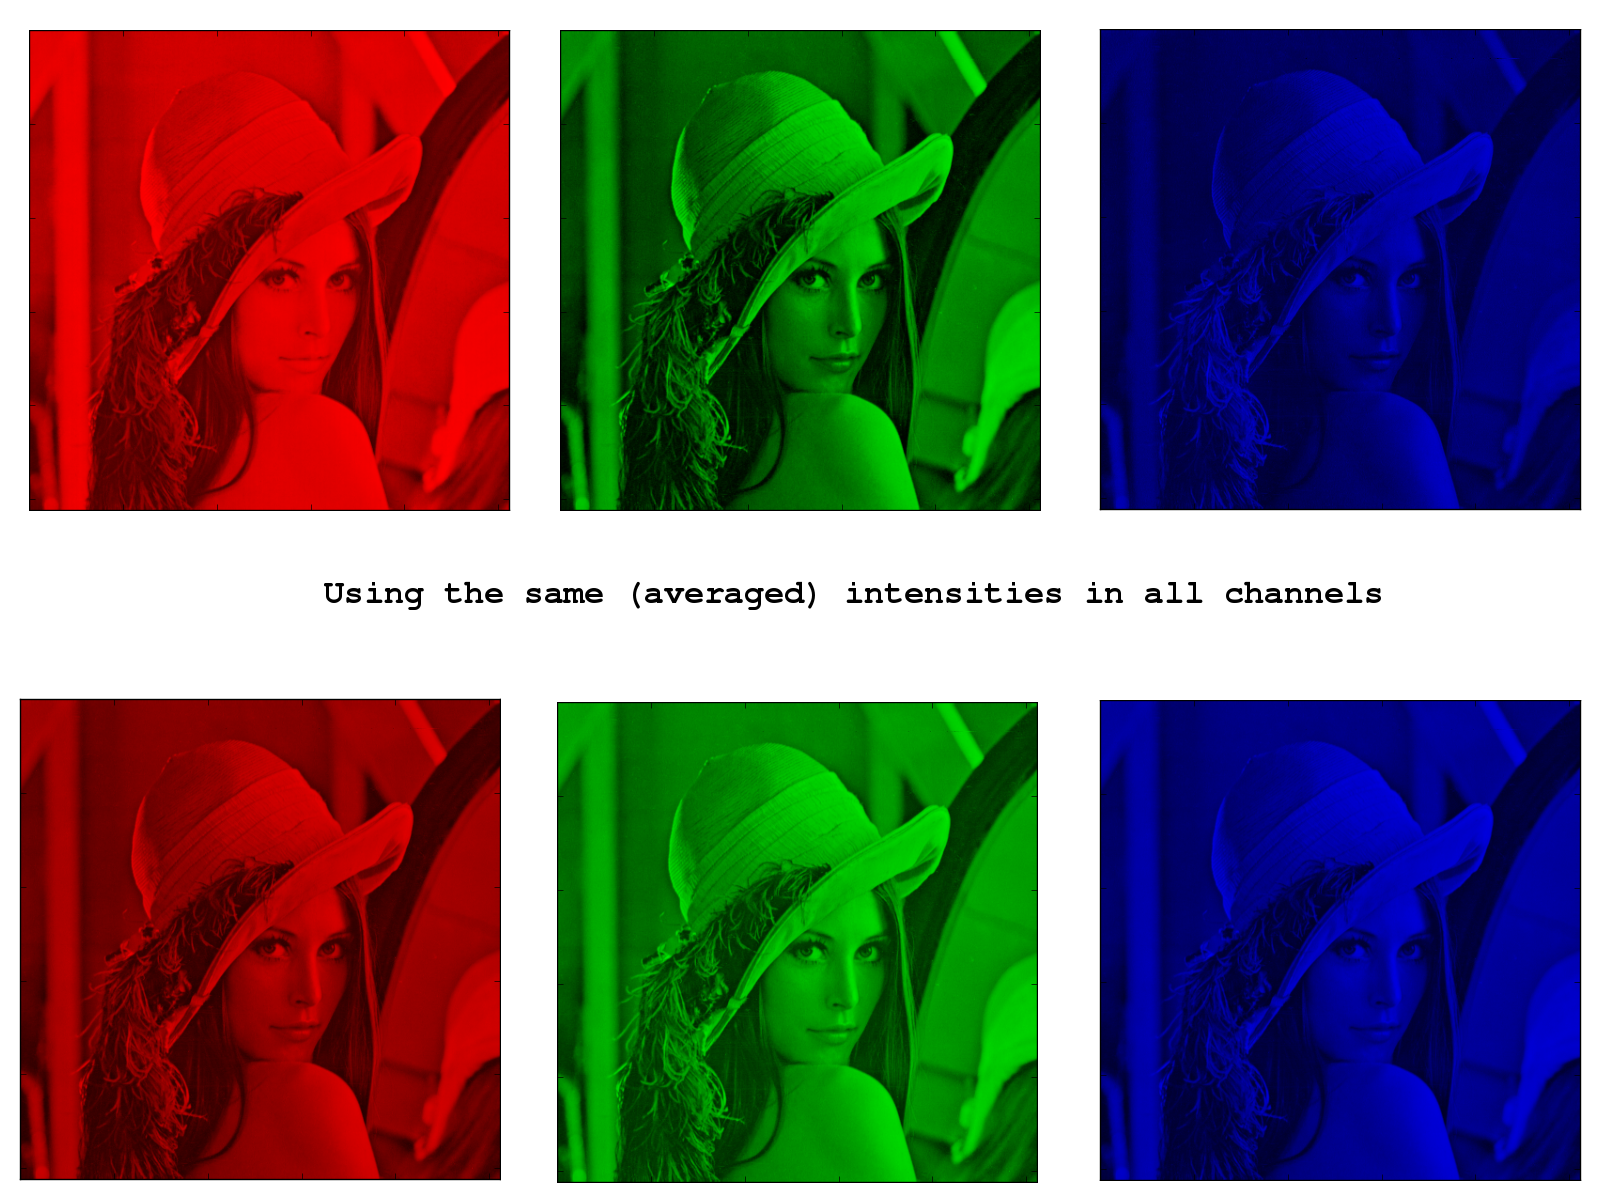
Looking at the blue channel.
This is definitely flawed, since the intensity of blue in the image they have taken may be less and hence giving us a false positive.
We could instead gray-scale the image and use these pixel values in the 3 channels and look at the images.
This also eliminates the problem of the image being captured through a Bayer filter.
Here’s some python code to do the same. (uses matplotlib)
def show_channels(I):
    for i in range(3):
        J = zeros_like(I)
        J[:, :, i] = I[:, :, i]
        figure(i)
        imshow(J)

def show_grey_channels(I):
    K = average(I, axis=2)
    for i in range(3):
        J = zeros_like(I)
        J[:, :, i] = K
        figure(i+10)
        imshow(J)
Pixelating the blue channel
Again, there was this argument of use of Bayer filter affecting the image and the like.
What I did was to swap the channels, and then look at the images. However I swapped the channels, the image where the green channel was pixelated always looked the worst. The difference between blue and red was less noticeable, I feel.
Here’s the code.
def zoom(x, factor=2):
    rows, cols = x.shape
    row_stride, col_stride = x.strides
    view = np.lib.stride_tricks.as_strided(x,
                        (rows, factor, cols, factor),
                        (row_stride, 0, col_stride, 0))
    return view.reshape((rows*factor, cols*factor))

def subsample(I):
    for i in range(3):
        J = I.copy()
        J[:, :, i] = zoom(I[::4, ::4, i], 4)
        figure(i)
        title("%s channel subsampled" %colors[i])
        imshow(J)

def swap_subsample(I, k=1):
    for c, color in enumerate(colors):
        print "%s <-- %s" %(colors[c], colors[(c+k)%3])
    for i in range(3):
        J = zeros_like(I)
        for j in range(3):
            J[:, :, j] = I[:, :, (j+k)%3]
        J[:, :, i] = zoom(I[::4, ::4, (i+k)%3], 4)
        figure(i+10)
        title("%s channel subsampled" %colors[i])
        imshow(J)
Images
Here are a few images. (View them in their original size)