A few weeks ago, I was watching a talk title Design is a Search Problem by @mbostock of d3 fame, which he gave a couple of years ago while he was still working at the New York Times.
Primarily, he’s trying to drive home the point that the process of coming up with a good design (for a data visualization) is a hard problem – there are a few thumb rules and philosophical guidelines on how to come up with one, but there are no silver bullets to come up with a good design for every scenario.
He makes the case for a process that lets you efficiently try out a lot of designs to see what works and what doesn’t. In the latter part of his talk he goes on to demo an internal tool at NYT called Preview, that they use view, explore and contribute to each others’ work. I hoped that in the two years since the talk was given, this tool would’ve been open-sourced, but it was not to be.
So, I started working on my own project, also called Preview, that has a similar set of features to those described in the talk. Even if I am not working in a visualization team, I think it would be pretty useful to have such a tool to explore the work of other people to learn more about their process, when coming up with a visualization/design.
Currently, Preview lets you keep track of all the repositories of a single
user/organisation on GitHub. Any repository with an index.html file is assumed
to be a repository of interest, and tracked.
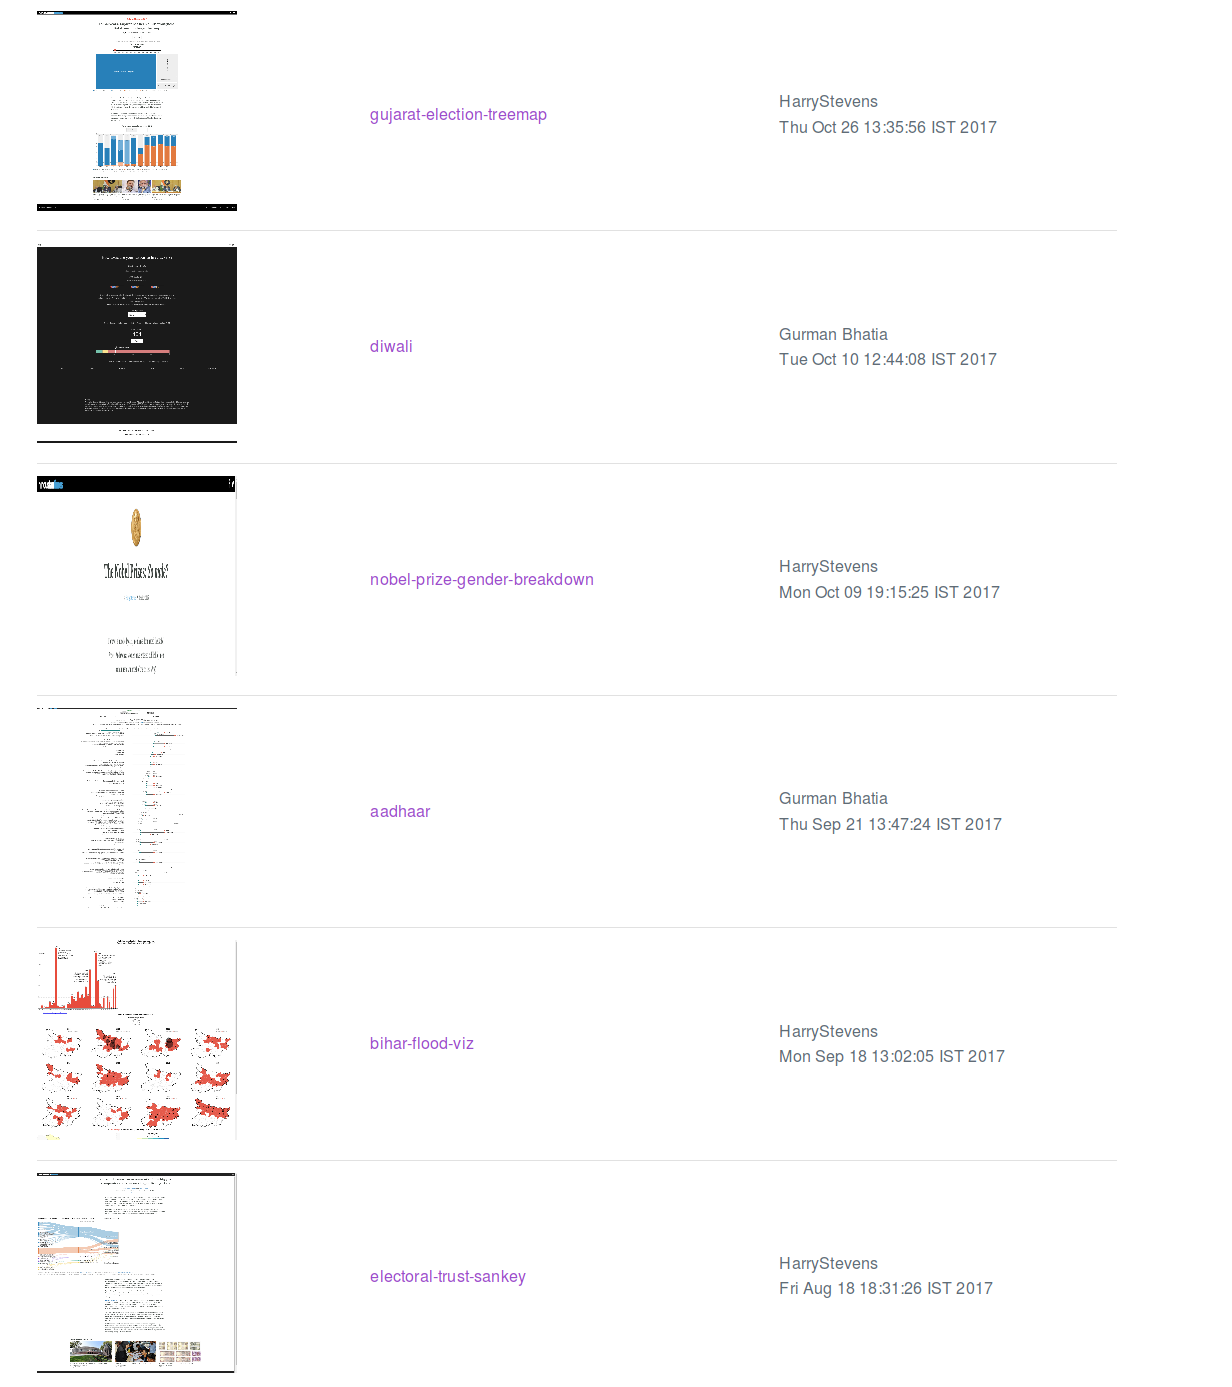
It also lets you view the screenshots for a repository over all the commits in the repository. This is intended to be some sort of a visual version of git log.
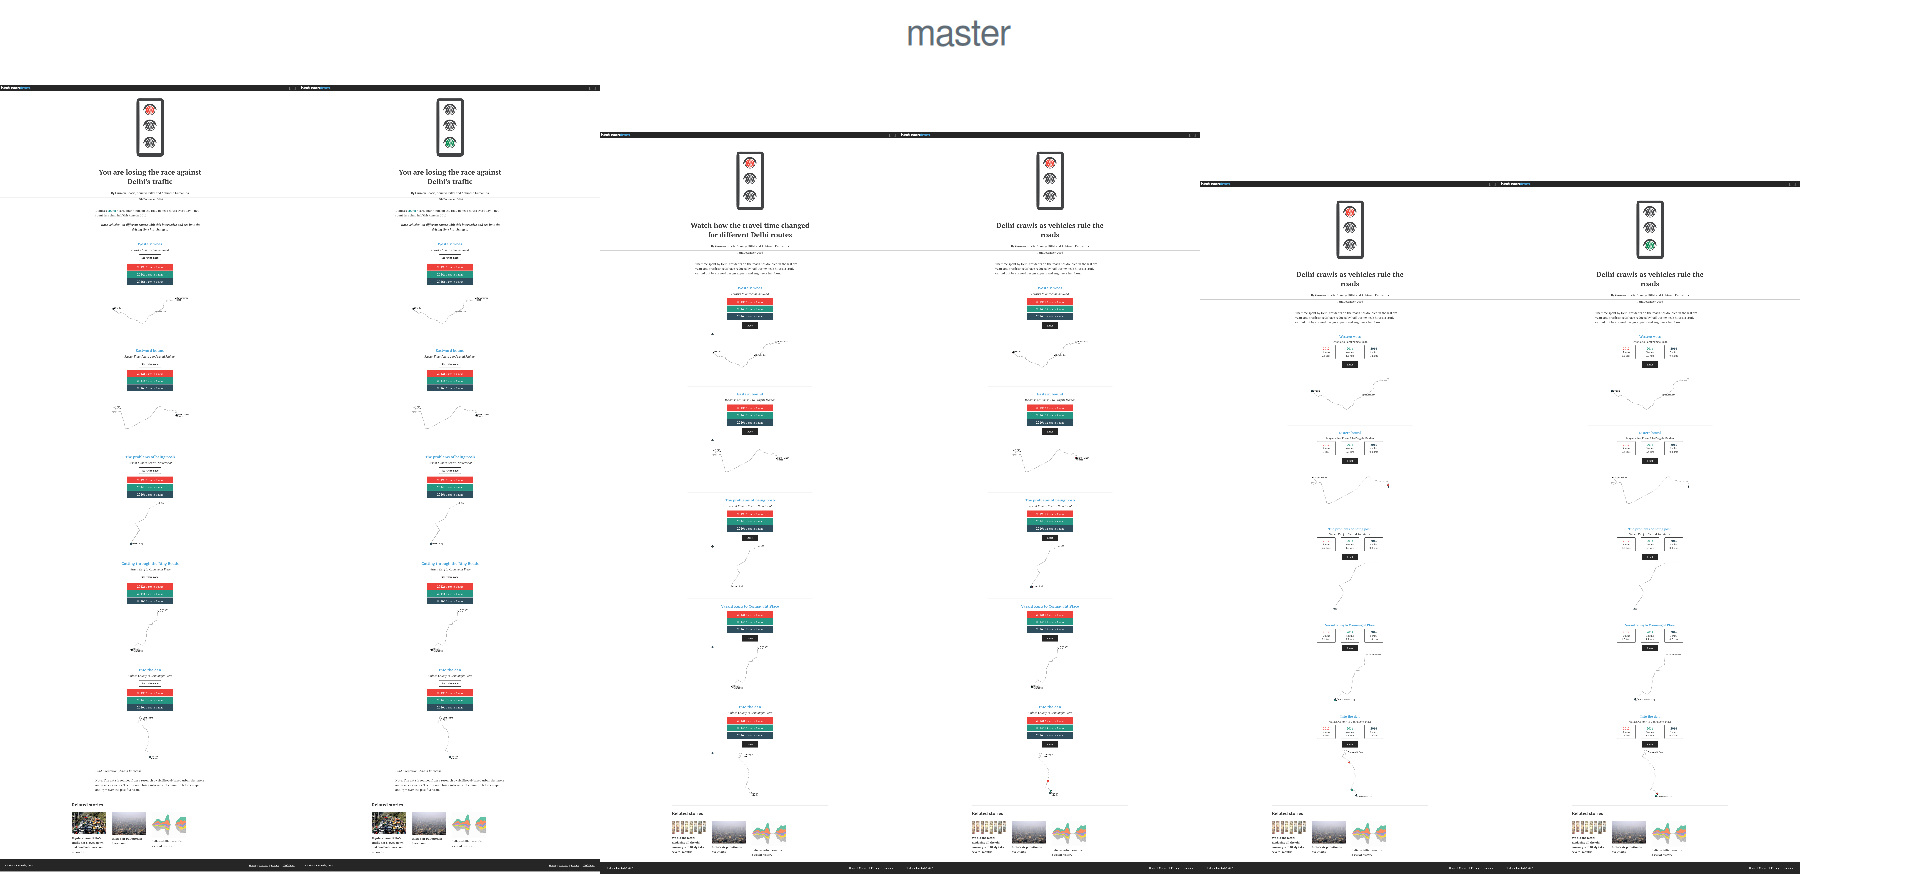
You can also view any repository at the latest commit on any branch.
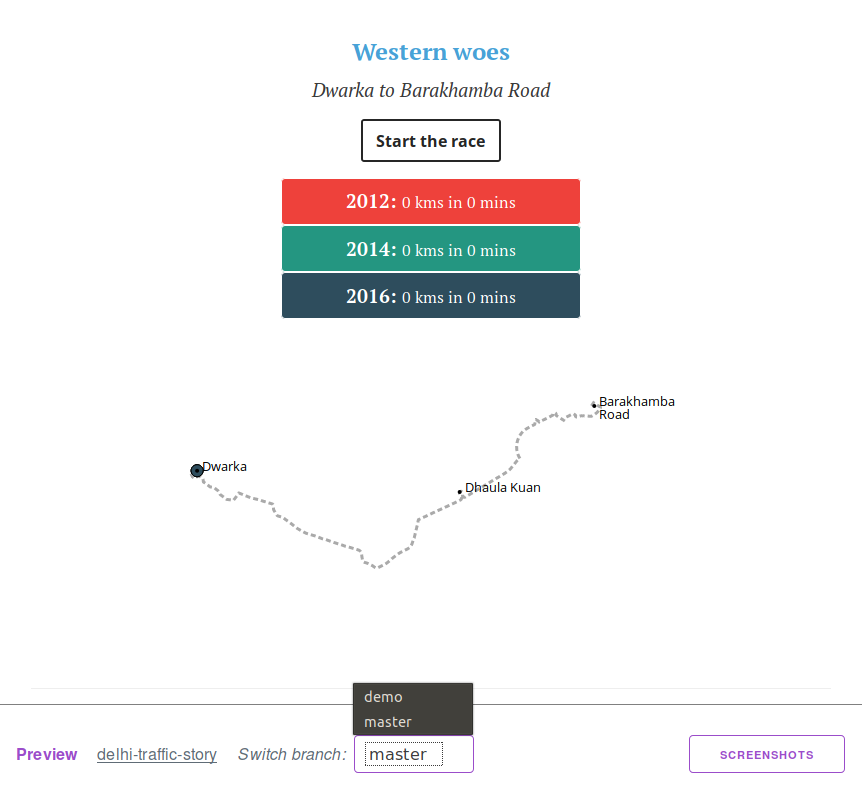
The tool is pretty new and quite brittle right now, but already quite functional and useful, I think. If you do give it a spin, I’d love to hear your comments and feedback.